Checklist DevOps & Observability
Data Platform Monitoring Checklist
A production checklist for application, API, report engine, SQL, Fabric and data-quality monitoring.
- Type
- Checklist
- Level
- Intermediate
- Updated
- Format
- Printable
In short
Verify that every production data request and execution is measurable from user impact through platform dependencies and data freshness.
Who it is for
- Data engineers and platform operators
- Teams preparing production monitoring reviews
What it helps you do
- Check coverage across each system layer
- Connect service health to request and execution evidence
Use the checklist with one representative user request and one scheduled data execution. Confirm not only that a metric exists, but that its ownership, dimensions, retention, and incident response are understood.
Application
- Request volume and active concurrency are visible by feature.
- Error rate uses a meaningful denominator and separates client from server failures.
- P50, P95, and P99 latency include sample count.
- Every request receives a trusted request ID and correlation ID.
- Deployments and configuration changes appear on operational timelines.
API
- Requests can be grouped by authenticated client, API key identifier, and tenant.
- Response time separates queue, service, and dependency time.
- Payload and response size are bounded and measured.
- Rate limits and throttling responses are observable.
- Secrets, tokens, and unrestricted customer values are excluded from logs.
Report engine
- Cache hits and misses are measured by report class.
- Total duration and query duration are recorded separately.
- Rows and output bytes are captured.
- Report parameters are validated and normalized.
- Tenant identity is derived from trusted authentication and included in cache isolation.
- Expensive or large reports have a bounded asynchronous path.
SQL
- Active sessions and requests are visible with database, login, host, and program context.
- Blocking chains, waits, CPU, logical reads, reads, writes, and duration are available.
- Current-state DMV monitoring is complemented by Query Store or retained history.
- Statement text and captured plans receive appropriate access protection.
- Polling overhead is measured and controlled.
Microsoft Fabric
- Pipeline and notebook executions share execution and correlation identifiers.
- Pipeline duration, notebook duration, failures, retries, and rows processed are captured.
- Session startup is separated from Spark compute.
- Read, shuffle, write, and orchestration time can be distinguished.
- Capacity and concurrency pressure are visible for the incident window.
Data and SLA
- Freshness is calculated from the delivered data, not only pipeline completion.
- Expected and actual row counts or reconciliation totals are retained.
- SLA and service-level objective breaches have an owner.
- Late, partial, duplicate, and quarantined data are distinguishable.
- Failure drills verify that evidence remains available after recovery.
Review
For every alert, identify the action, owner, escalation path, and clearing condition. Remove unactionable alerts. Test cross-system correlation, tenant access controls, retention, redaction, and dashboard drill-downs at least whenever the architecture changes.
Go deeper: related articles
DevOps & Observability
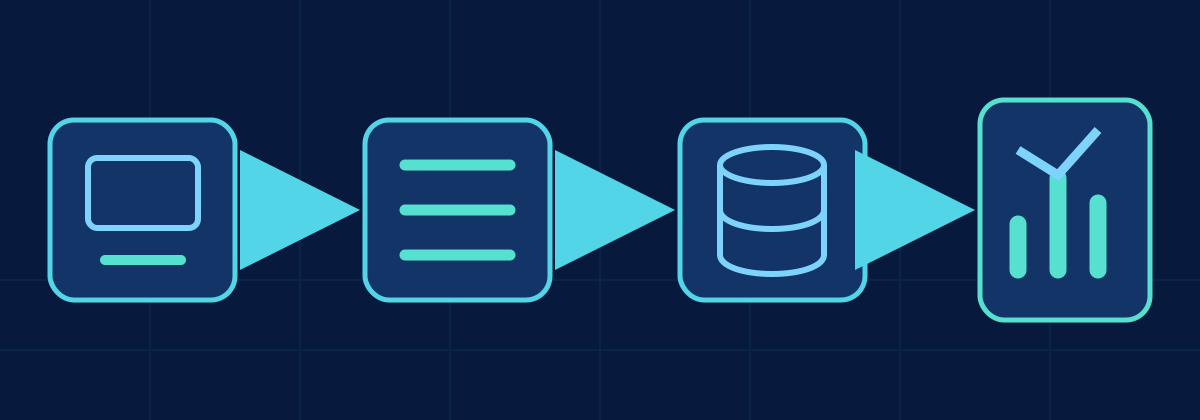
Monitoring a Data Platform: What Should You Actually Measure?
A practical monitoring model connecting clients, applications, APIs, report engines, data platforms, compute and storage.
DevOps & Observability
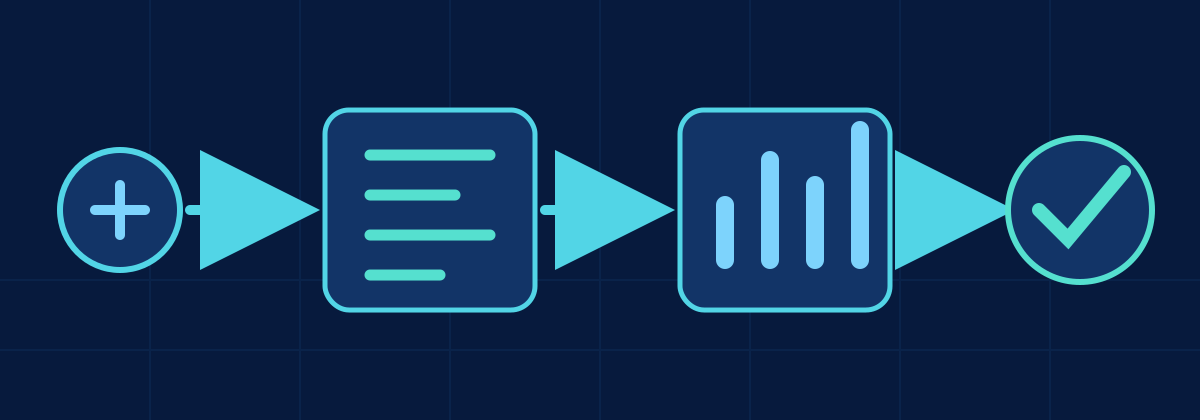
Designing an Execution Log for Data Pipelines
Design a durable pipeline execution log with run identity, parent-child relationships, transitions, retries and correlation.
DevOps & Observability
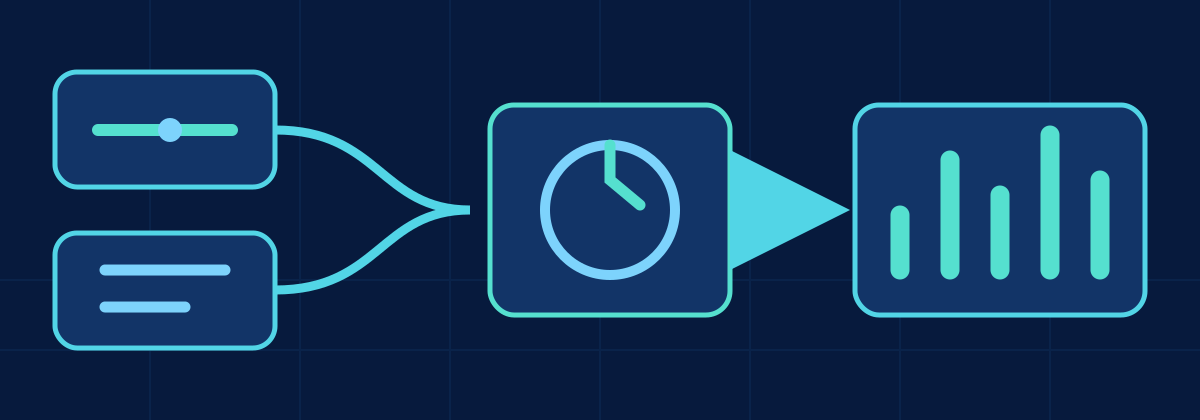
Monitoring Microsoft Fabric Pipelines and Notebooks
Separate Fabric orchestration, session startup, Spark compute, data read, shuffle and write time with connected telemetry.
DevOps & Observability
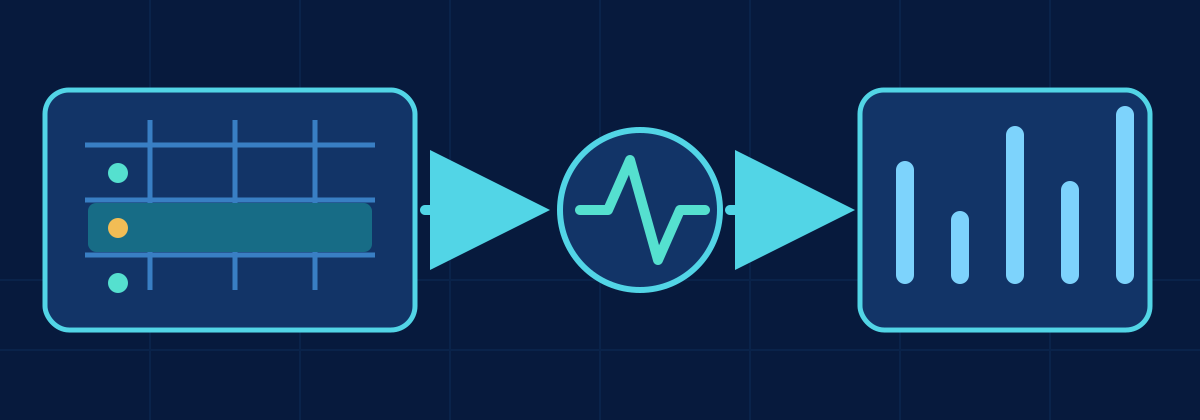
Monitoring SQL Server Workloads in Real Time
Inspect active SQL Server requests, sessions and connections, then connect current state to retained Query Store history.
Planned articles on these topics
Build it: related projects
Modern Report Engine
A planned reference implementation for secure, tenant-aware analytical requests, cache decisions, Fabric queries, exports and operational monitoring.
AI Data Assistant
A reference application for safe LLM access to structured enterprise data: approved tools, authorization before data access, validated answers and full observability.
SQL Performance Analyzer
A practical SQL Server and Python tool for investigating workload: active sessions, blocking, waits and expensive queries, grouped so the real problem stands out.
Related talks
From Notebook to Production: Git and CI/CD in Microsoft Fabric
How a Fabric notebook or pipeline gets from a developer's workspace to production safely: Git integration, dev/test/prod workspaces, deployments, environment configuration and release practices.
Formats: Talk · Workshop · Webinar · Internal session
Designing Microsoft Fabric for Scale
The architecture decisions that decide whether a Fabric platform stays manageable as data, teams and workloads grow: workload boundaries, Lakehouse vs Warehouse, Medallion layers, capacity, Git and observability.
Formats: Talk · Webinar · Workshop · Internal session