DevOps & Observability
Monitoring SQL Server Workloads in Real Time
Inspect active SQL Server requests, sessions and connections, then connect current state to retained Query Store history.
On this page
Monitoring SQL Server Workloads in Real Time is a production engineering concern, not just an implementation detail. The useful design connects user intent to controlled execution, measurable outcomes, and evidence that remains available during an incident.
Current state
Use sys.dm_exec_requests for active request status, command, CPU time, elapsed time, logical reads, reads, writes, wait, database, and blocking session. Join sys.dm_exec_sessions for login, host, program and session totals. Join sys.dm_exec_connections for connection and client context.
Interpretation
High duration with little CPU may be a blocked request. CPU, reads, writes, duration, waits, database, login, host, and program must be interpreted together. Client labels can be absent or spoofed, so connect workload origin to authenticated application telemetry or controlled session context.
Historical state
Dynamic management views are current-state evidence. Completed requests disappear and many counters reset after restart. Query Store retains query, plan, and interval runtime history for regressions and before-after analysis. Extended Events and application telemetry fill gaps that Query Store does not cover.
Safe collection
Use appropriate permissions, protect statement text, redact sensitive values, and avoid aggressive polling. Start with blocking and active resource consumers, then pivot to Query Store and the existing SQL Server Troubleshooting series for the same time window.
Production considerations
Treat tenant isolation as a first-class boundary. Derive tenant identity from authenticated claims or a trusted service mapping, never only from tenant_id supplied by a browser. Apply tenant filters in the controlled query layer, include tenant identity in cache keys, protect stored results, and write an audit event for access. Redact secrets and sensitive filter values from ordinary logs.
Every operation needs a request or execution ID plus a correlation ID that crosses service boundaries. Capture UTC timestamps, status, duration, workload size, and error code. Keep high-cardinality detail in logs or traces rather than unbounded metric labels. Make telemetry asynchronous and bounded so a monitoring outage cannot take down the production path.
Define limits before scale exposes missing policy: maximum date range, maximum rows and bytes, execution timeout, concurrency per tenant, queue capacity, retry budget, and artifact retention. Reject invalid work early with a specific response. Retry only transient operations and use idempotency keys where duplicate execution could create extra files or charges.
Validate with representative data and failure drills. Test empty results, boundary dates, invalid dimensions, cross-tenant attempts, dependency timeouts, cache corruption, cancellation, retries, and large outputs. Compare the visible result with source totals and retain enough context to reproduce the decision. Operational readiness means an on-call engineer can identify the failing layer and take a bounded action without guessing.
Tradeoffs and failure modes
More telemetry improves diagnosis but adds storage, privacy, and cardinality costs. More caching reduces query load but creates freshness and invalidation risks. More flexible requests improve usefulness but expand the security and performance surface. Prefer explicit report or execution contracts, allow-listed variation, and measured exceptions over an unrestricted interface.
Watch for partial success: a pipeline can write data and fail before logging completion; a report can finish after its caller disconnects; a cache write can fail after a valid result was returned. Model those outcomes explicitly. Do not relabel an unknown value as zero, and do not overwrite failed attempts when a retry succeeds. Preserve the original error even if secondary logging also fails.
Practical rollout
Begin with one important workload and a small set of service objectives. Instrument the complete path, establish a baseline, and review evidence with application, data, security, and operations owners. Add alerts only when the receiver has a documented response. Expand by workload class after identifiers, access controls, and retention have proved reliable. This creates an operating model, not merely a dashboard.
Operational review questions
Before release, ask whether a responder can identify the affected client, tenant, workload class, code version, and dependency from retained evidence. Confirm that success means the intended data was delivered, not merely that a process exited without an exception. Check whether a retry is safe, whether cancellation stops downstream work, and whether partial output can be mistaken for a complete result.
During review, compare normal, peak, and failure behavior with representative volume. Verify that limits produce explicit outcomes and that dashboards distinguish rejected, queued, executing, completed, failed, and cancelled work. Assign ownership for the service, data contract, alerts, cache or operational store, and recovery procedure. Record decisions close to the implementation so future changes preserve the reasoning. Finally, test the investigation path with someone who did not build the feature; if that person cannot move from symptom to a specific execution and dependency, the design still lacks operational context.
Related content
SQL Server
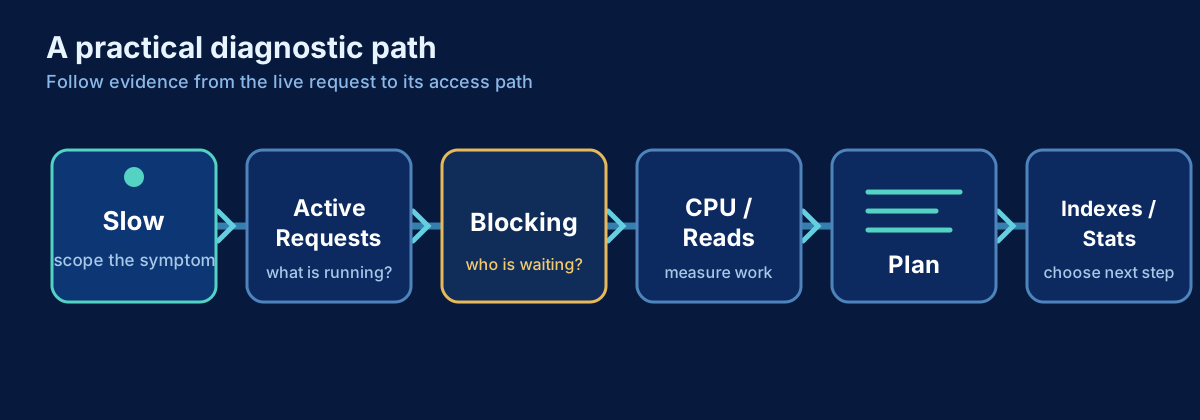
SQL Server Is Slow: A Practical Troubleshooting Workflow
A production-first workflow for turning a vague SQL Server slowdown into evidence, a likely cause, and a safe next step.
SQL Server
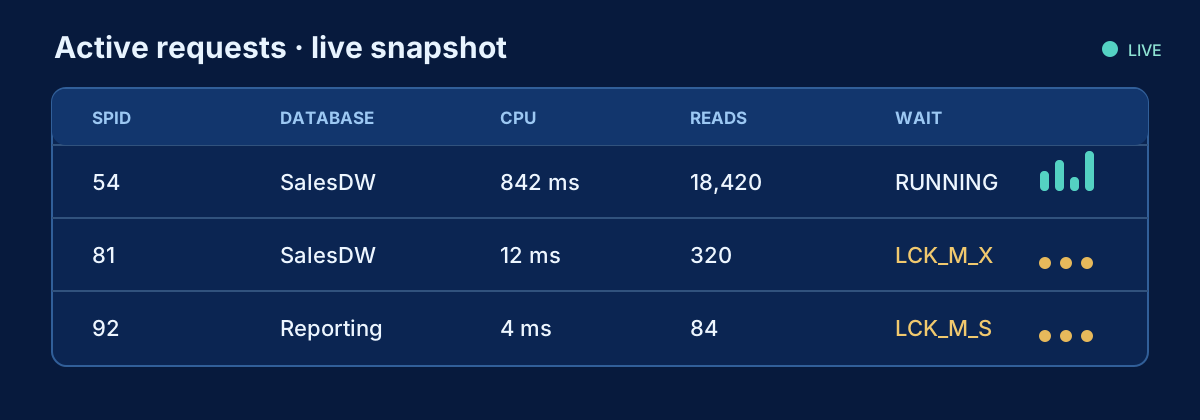
How to Find What Is Running in SQL Server Right Now
A production-safe DMV query for active SQL Server requests, including statement text, identity, resource use, waits and blocking.
SQL Server
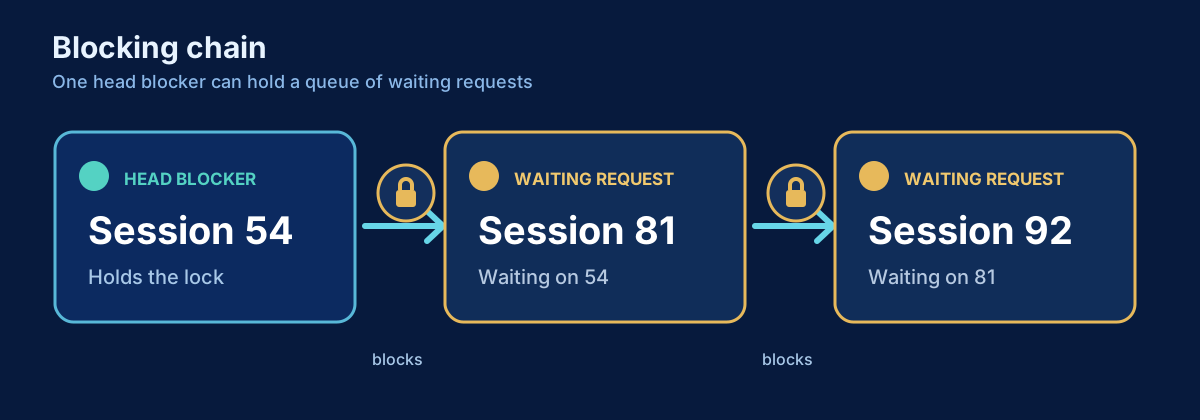
How to Find Blocking in SQL Server
Find blocked requests, trace blocking chains to the head blocker, and inspect the responsible session and transaction safely.