SQL Server
How to Find What Is Running in SQL Server Right Now
A production-safe DMV query for active SQL Server requests, including statement text, identity, resource use, waits and blocking.
On this page
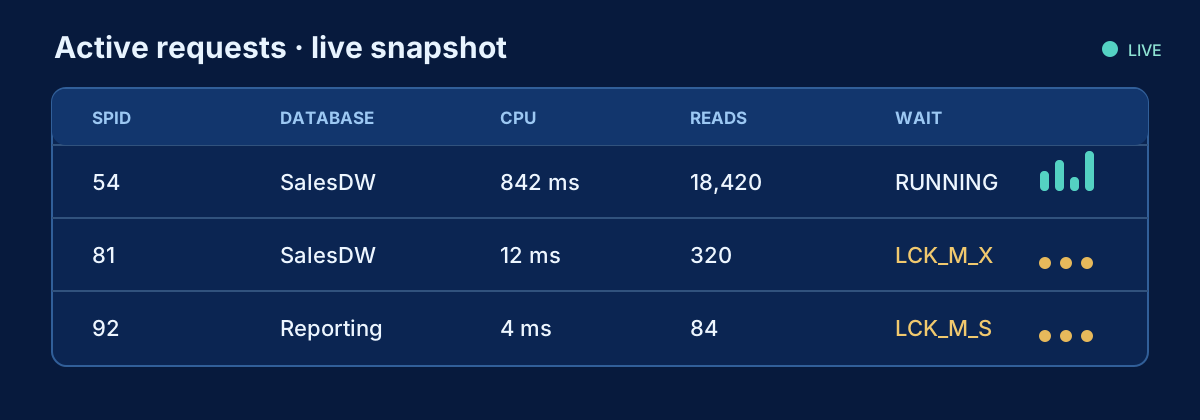
When users say an application is slow, the most useful first snapshot answers two questions: what is executing now, and who initiated it? SQL Server exposes both through documented dynamic management views. The request identifies the current unit of work; the session identifies the connected client; the connection contributes network and connection context; and the SQL text function resolves the batch text.
This is a live view, not history. A fast statement can finish between samples, and a completed statement will disappear from sys.dm_exec_requests. Capture the output with its timestamp before intervening.
Problem
Suppose users report slow reports from ReportingDb. You need to distinguish a busy report from a blocked request, an API spike, or unrelated maintenance. Activity Monitor may provide a quick view, but a query is repeatable, filterable, exportable, and explicit about which counters you are comparing.
Quick diagnostic
Run the query without filters once. Look for long elapsed time, a nonzero blocking session, repeated wait types, high CPU or logical reads, and concentration by database or application. Then set one or more parameters to narrow the result. Leaving every parameter NULL means “show all user requests.”
Query
DECLARE @SessionId int = NULL;
DECLARE @DatabaseName sysname = NULL;
DECLARE @LoginName sysname = NULL;
DECLARE @HostName nvarchar(128) = NULL;
DECLARE @ProgramName nvarchar(128) = NULL;

SELECT
    SYSDATETIMEOFFSET() AS captured_at,
    r.session_id,
    r.request_id,
    DB_NAME(r.database_id) AS database_name,
    s.login_name,
    s.original_login_name,
    s.host_name,
    s.program_name,
    c.client_net_address,
    s.status AS session_status,
    r.status AS request_status,
    r.command,
    r.start_time,
    r.total_elapsed_time AS elapsed_time_ms,
    r.cpu_time AS cpu_time_ms,
    r.logical_reads,
    r.reads AS physical_reads,
    r.writes,
    r.wait_type,
    r.wait_time AS wait_time_ms,
    r.wait_resource,
    NULLIF(r.blocking_session_id, 0) AS blocking_session_id,
    SUBSTRING(
        sql_text.text,
        (r.statement_start_offset / 2) + 1,
        ((CASE r.statement_end_offset
            WHEN -1 THEN DATALENGTH(sql_text.text)
            ELSE r.statement_end_offset
          END - r.statement_start_offset) / 2) + 1
    ) AS current_statement,
    sql_text.text AS batch_text
FROM sys.dm_exec_requests AS r
INNER JOIN sys.dm_exec_sessions AS s
    ON s.session_id = r.session_id
LEFT JOIN sys.dm_exec_connections AS c
    ON c.session_id = s.session_id
OUTER APPLY sys.dm_exec_sql_text(r.sql_handle) AS sql_text
WHERE s.is_user_process = 1
  AND r.session_id <> @@SPID
  AND (@SessionId IS NULL OR r.session_id = @SessionId)
  AND (@DatabaseName IS NULL OR DB_NAME(r.database_id) = @DatabaseName)
  AND (@LoginName IS NULL OR s.login_name = @LoginName)
  AND (@HostName IS NULL OR s.host_name = @HostName)
  AND (@ProgramName IS NULL OR s.program_name = @ProgramName)
ORDER BY r.total_elapsed_time DESC, r.session_id, r.request_id;
The query needs server-state visibility to see other sessions. Depending on version and platform, that is normally VIEW SERVER STATE or VIEW SERVER PERFORMANCE STATE. Without sufficient permission, a user may see only their own activity.
Session ID versus request ID
A session_id identifies a client session, historically called a SPID. One pooled application connection may remain open for a long time and execute many requests over time. A request_id identifies a request currently executing inside that session. Most ordinary sessions have one active request at a time, but Multiple Active Result Sets can allow more than one. For a precise sample, record both values.
Do not treat session counters and request counters as interchangeable. Values on sys.dm_exec_requests, including elapsed time and request CPU, describe the current request. Session-level totals may cover multiple completed requests since the session was established.
How to read the result
database_name comes from the request’s database context. login_name is the current security context, while original_login_name helps when execution context has changed. host_name and program_name are supplied by the client and are useful attribution signals, but an application can omit or spoof them; corroborate them with connection strings and application telemetry.
current_statement extracts the active statement from a larger batch or stored procedure. batch_text provides surrounding context. Offsets are byte offsets into Unicode text, which is why they are divided by two. An end offset of -1 means the statement runs to the end of the batch.
elapsed_time_ms is wall-clock duration since the request began. cpu_time_ms is processor time consumed by the request. logical_reads counts pages accessed through the buffer pool and is often a strong measure of work. physical_reads records reads that required physical I/O for this request. writes records writes performed by the request, not necessarily only final table data.
wait_type is the request’s current wait at the instant of the sample. It can change rapidly. wait_resource adds context, and blocking_session_id points to a session currently blocking the request. A zero is displayed as NULL here so real blockers stand out.
What the result may mean
High elapsed time with low CPU can indicate waiting, including blocking, I/O, memory grant, client consumption, or another resource. High CPU with high logical reads can indicate a large scan, repeated work, a poor join strategy, or simply a legitimately large request. Many similar requests from ApiService can indicate concurrency or retry pressure even if no single request looks extreme.
One row is rarely enough for intermittent issues. Take a few samples several seconds apart and compare. A request whose counters continue increasing is working; one whose wait and blocker remain unchanged needs investigation along that dependency chain.
What to check next
If blocking_session_id is populated, inspect the head blocker and its transaction rather than killing a blocked request. If reads or CPU dominate, capture the execution plan and compare estimated with actual rows. For a problem that ended, use Query Store or monitoring history. To understand one connection deeply, use the companion session-ID query.
Common mistakes
- Querying only
sys.dm_exec_sessionsand assuming every connected session is executing. - Treating sleeping sessions as harmless without checking for an open transaction.
- Sorting only by duration and labelling every long request bad.
- Trusting client-supplied host and program names as an authentication boundary.
- Running the query once and assuming the snapshot represents the entire incident.
- using
NOLOCKor clearing cache as a response to evidence not yet understood.
Production notes
The query reads lightweight DMVs, but frequent polling and retaining full batch text for every request still has a cost. Use an interval appropriate to the incident, timestamp every capture, and store samples outside the affected database when possible. Redact SQL text before sharing it because batches can contain sensitive literal values.
This query deliberately shows active user requests. Sleeping sessions do not appear because they have no row in sys.dm_exec_requests. That is correct for “what is running now,” but it means a separate session or transaction query is required to find a sleeping connection that left a transaction open.
Related content
SQL Server
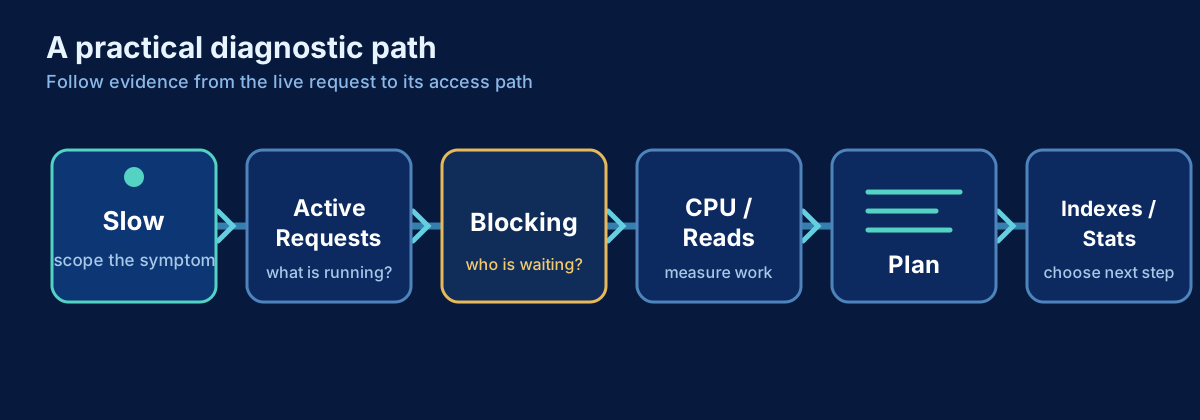
SQL Server Is Slow: A Practical Troubleshooting Workflow
A production-first workflow for turning a vague SQL Server slowdown into evidence, a likely cause, and a safe next step.
SQL Server
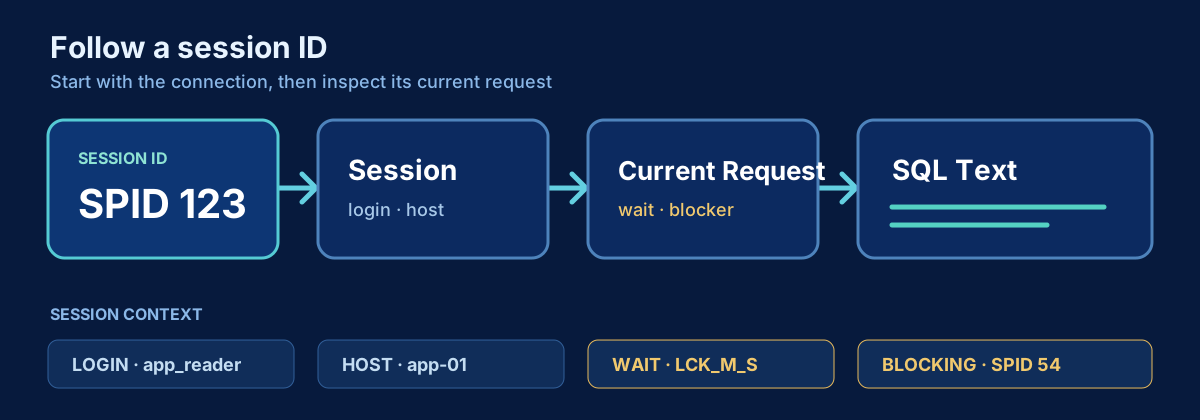
How to Get a SQL Server Session ID and See What It Is Doing
Find your SQL Server session ID, investigate another session, and inspect its request, SQL text, waits, blocking and open transaction state.
SQL Server
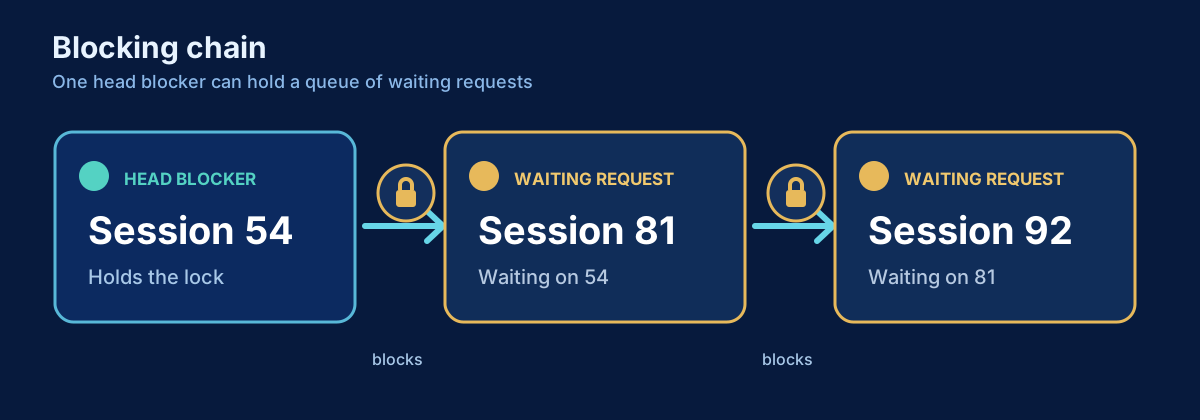
How to Find Blocking in SQL Server
Find blocked requests, trace blocking chains to the head blocker, and inspect the responsible session and transaction safely.