SQL Server
SQL Server Is Slow: A Practical Troubleshooting Workflow
A production-first workflow for turning a vague SQL Server slowdown into evidence, a likely cause, and a safe next step.
On this page
“SQL Server is slow” is an alert, not a diagnosis. It may mean one report exceeded its normal runtime, every request from an API is waiting behind a transaction, storage latency increased, or a new plan caused one statement to read millions of pages. The first job is to replace the broad report with a specific, time-bound description.
The safest workflow moves from scope to evidence and only then to change. Capture volatile evidence before killing a session, restarting a service, clearing the plan cache, or rebuilding an index. Those actions can remove the symptoms and the evidence while leaving the cause untouched.
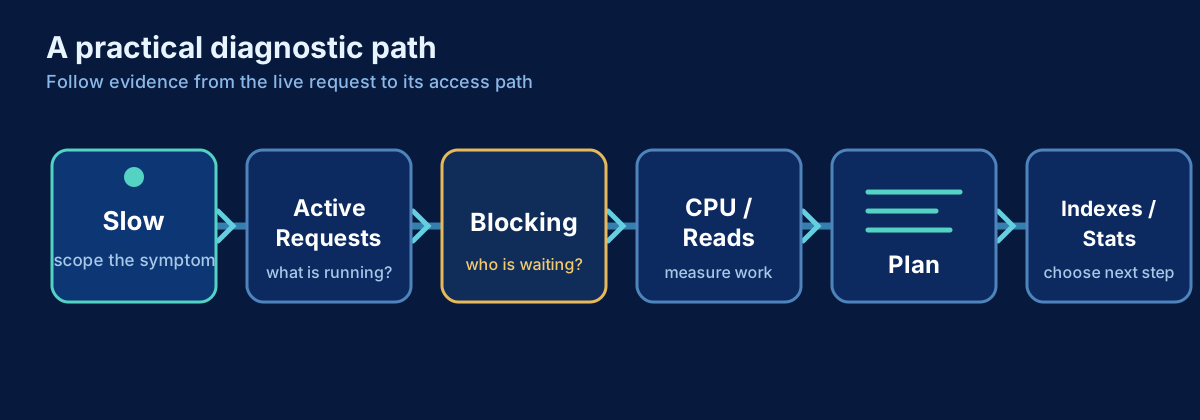
- 1SQL Server slowRecord the symptom and time window
- 2ScopeWhole server, database, application, user or request?
- 3Active requestsSession, statement, database, login and application
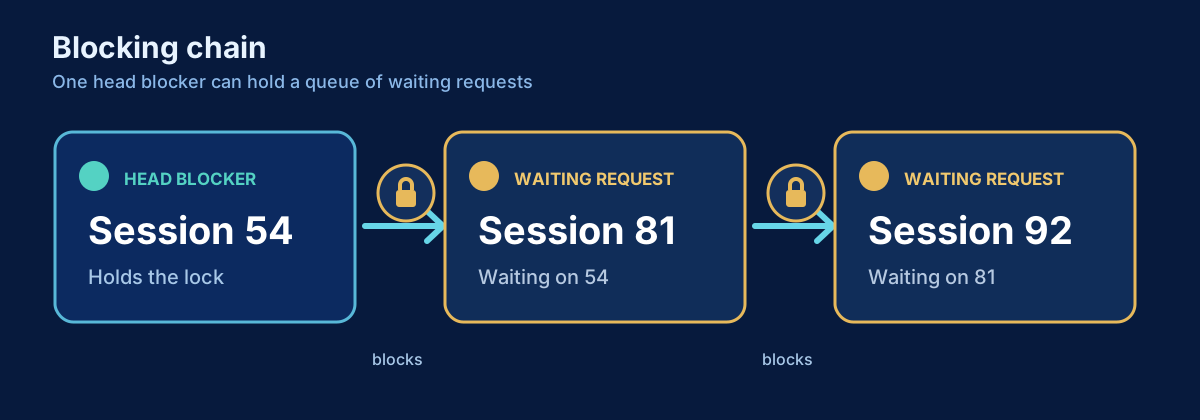
- 4BlockingFind the head blocker and transaction age
- 5Resource usageCPU, logical reads, writes, elapsed time and waits
- 6Query / planInspect the plan and Query Store history
- 7Indexes / statisticsCheck access paths and cardinality inputs
- 8Historical comparisonDeployment, configuration or workload change
- 9ValidateMeasure the same workload after one change
Problem: define what “slow” means
Start with the affected workload and clock time. Ask whether all applications are slow or only one operation; whether failures are continuous or intermittent; and whether the problem is happening now. Record the database, expected and observed duration, application, login, host, and an example request identifier if the application exposes one.
“Reports from ReportingDb started taking 90 seconds instead of 8 seconds at 14:10” is actionable. It suggests a database and time window and can be compared with Query Store, monitoring, deployments, and scheduled jobs. “CPU is high” is not equivalent to “CPU is the cause.” Useful work, a scan caused by a poor estimate, and spin caused by repeated compilations can all consume CPU for different reasons.
Quick diagnostic: current or historical?
If the slowdown is happening now, inspect active requests and blocking first. Dynamic management views are a live snapshot: run the query more than once and save the output with a timestamp. If the slowdown ended, use Query Store, monitoring history, Extended Events, application telemetry, and job history. The plan cache may help, but it is not a durable audit log and can lose entries through eviction, recompilation, restart, failover, or cache-clearing operations.
Before changing anything, capture:
- the report time and server time, including time zone;
- active session and request identifiers;
- database, login, host, application and SQL text;
- status, wait type, blocking session, CPU, reads, writes and elapsed time;
- the relevant execution plan or Query Store query and plan identifiers;
- recent deployments, configuration changes, maintenance and unusual workload volume.
Query: capture active requests
Run this from a login with VIEW SERVER STATE on versions where that permission is required. On newer versions, the permission may be VIEW SERVER PERFORMANCE STATE. The query is read-only and excludes its own session.
SELECT
    SYSDATETIMEOFFSET() AS captured_at,
    r.session_id,
    r.request_id,
    DB_NAME(r.database_id) AS database_name,
    s.login_name,
    s.host_name,
    s.program_name,
    r.status,
    r.command,
    r.wait_type,
    r.wait_time AS wait_time_ms,
    NULLIF(r.blocking_session_id, 0) AS blocking_session_id,
    r.cpu_time AS cpu_time_ms,
    r.logical_reads,
    r.reads AS physical_reads,
    r.writes,
    r.total_elapsed_time AS elapsed_time_ms,
    SUBSTRING(
        text_info.text,
        (r.statement_start_offset / 2) + 1,
        ((CASE r.statement_end_offset
            WHEN -1 THEN DATALENGTH(text_info.text)
            ELSE r.statement_end_offset
          END - r.statement_start_offset) / 2) + 1
    ) AS current_statement
FROM sys.dm_exec_requests AS r
INNER JOIN sys.dm_exec_sessions AS s
    ON s.session_id = r.session_id
OUTER APPLY sys.dm_exec_sql_text(r.sql_handle) AS text_info
WHERE s.is_user_process = 1
  AND r.session_id <> @@SPID
ORDER BY r.total_elapsed_time DESC;
How to read the result
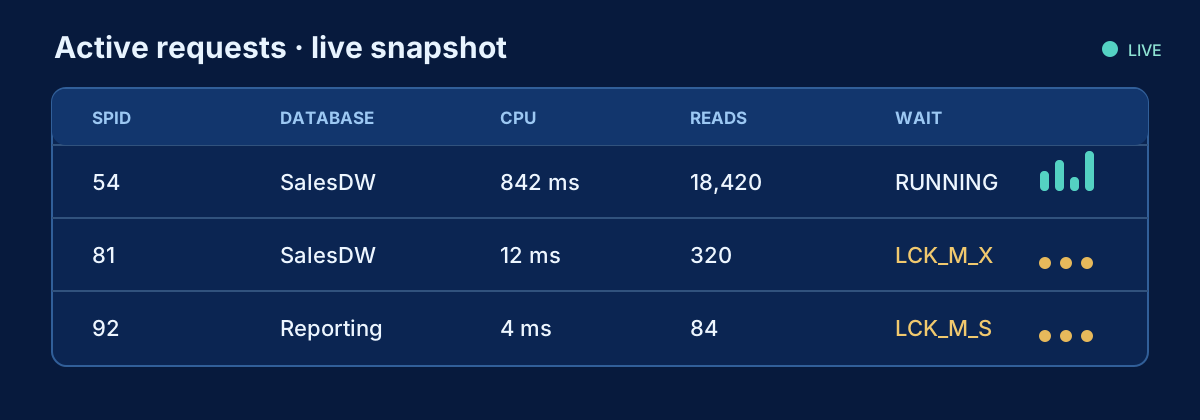
First look for concentration. One request with high elapsed time and modest CPU may be waiting; many requests with the same blocker may form a blocking chain; many expensive requests from one program_name may point to an application spike. wait_type explains what a request is currently waiting for, not the root cause. A lock wait directs you toward the blocker. PAGEIOLATCH_* indicates a wait for a data page from storage, but the next question is why that page was needed. ASYNC_NETWORK_IO can mean the client is consuming rows slowly, or simply that the query returns too many rows.
Compare elapsed time with CPU. Large elapsed time with small CPU often indicates waiting. High CPU and logical reads together commonly justify plan inspection. Writes may be data changes, worktable activity, or maintenance. Always interpret counters in the workload context; an overnight ETL request is not comparable to a single-row API lookup.
What the result may mean
A blocking session ID leads to the blocking workflow: locate the head blocker, inspect its transaction and SQL, and determine why it remains open. Repeated scans and high logical reads lead to the plan, estimates, indexes, statistics, predicates, and table size. A plan that recently changed leads to Query Store and a comparison of time windows. Load concentrated by login, host, or program leads to the calling application, connection pooling, concurrency, retry behavior, or a scheduled batch.
If the active snapshot looks normal, do not conclude that nothing happened. The expensive request may have completed between samples. Switch to historical evidence and verify that Query Store capture is enabled and healthy. Compare the incident window to a known-good window rather than comparing unrelated hours with different workloads.
What to check next
Inspect the execution plan only after identifying the statement. Compare estimated and actual rows when an actual plan can be collected safely. Check whether statistics represent current data distribution and whether an existing index supports the predicates. A missing-index suggestion is one input, not permission to create an index. Check overlap, width, write cost, and the actual plan.
Then check change history: code and schema deployments, compatibility level, database-scoped configuration, parameter patterns, data growth, statistics maintenance, infrastructure, failover, and scheduled jobs. A recent change is a hypothesis to test, not proof.
Common mistakes
- Blaming CPU because it is visible while ignoring the query doing the work.
- Killing the blocked session instead of investigating the transaction blocking it.
- Clearing the plan cache and destroying useful evidence across the server.
- Adding every missing-index recommendation without checking existing indexes.
- Using
NOLOCKas a blocking fix and accepting inconsistent results. - Comparing averages only, which can hide a small but important slow tail.
- Changing several variables at once and losing the ability to attribute improvement.
Production notes
DMVs are shared production structures, so keep diagnostic queries focused and avoid polling at an aggressive interval. Save results outside the affected instance when practical. Permissions differ by SQL Server version and hosting model. Query Store adds durable query and plan history, but its capture mode, size limit, cleanup state, and read/write status must be checked before relying on it.
Measure the same workload after a change: duration, CPU, logical reads, writes, execution count, waits, and error rate. If the evidence does not improve, revert when safe and revisit the hypothesis. The goal is not merely to make the alert disappear; it is to understand which condition changed and demonstrate that the system behaves better.
Related content

SQL Server
SQL Server Performance Tuning: A Practical Checklist
A production-oriented checklist for investigating SQL Server performance with evidence instead of guesses.
SQL Server
How to Find What Is Running in SQL Server Right Now
A production-safe DMV query for active SQL Server requests, including statement text, identity, resource use, waits and blocking.
SQL Server
How to Find Blocking in SQL Server
Find blocked requests, trace blocking chains to the head blocker, and inspect the responsible session and transaction safely.