SQL Server
SQL Server Performance Tuning: A Practical Checklist
A production-oriented checklist for investigating SQL Server performance with evidence instead of guesses.

On this page
- Start with evidence, not guesses
- Check active requests
- Group the workload
- Look for blocking
- Read the execution plan
- Check statistics
- Review indexes as a system
- Investigate parameter sensitivity
- Use Query Store for history
- Handle large modifications in batches
- Very large tables
- Performance checklist
- Closing thoughts
Performance tuning is an investigation, not a bag of fixes. “The database is slow” describes a symptom but gives no scope, time window, workload, or resource. Acting on it immediately—adding an index, clearing the plan cache, increasing memory, or killing a session—can hide the evidence and create another problem.
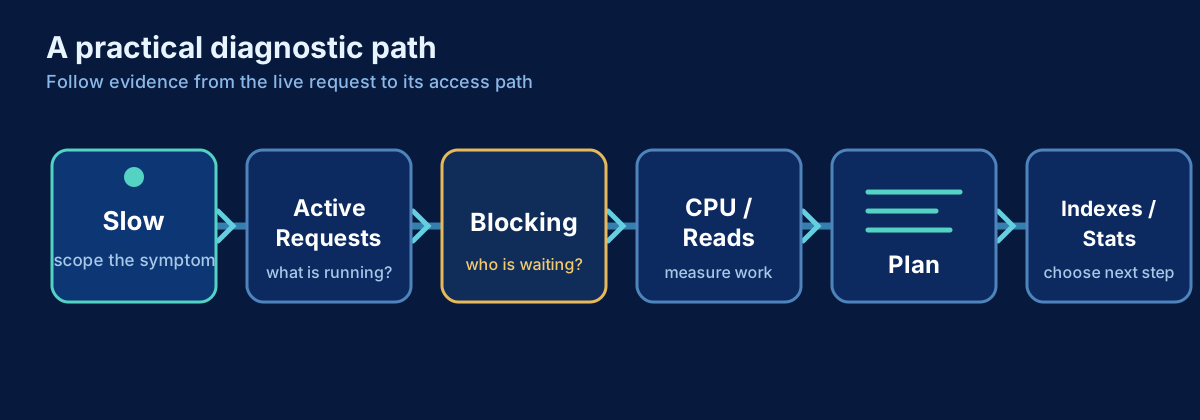
The practical goal is to move from a broad symptom to a reproducible statement: which workload was slow, when it was slow, what it waited for, how much work it performed, which plan it used, and what changed. The following checklist is designed for that progression.
- 1Slow systemThe reported symptom, not yet a diagnosis
- 2ScopeTime window, database, application, affected users
- 3Active requestsWhat is running now, and what it waits on
- 4BlockingFind the head of the blocking chain
- 5Expensive queriesCPU, reads, writes, duration and frequency
- 6PlanActual plan, estimated vs actual rows
- 7Statistics / IndexesCardinality inputs and access paths
- 8ChangeOne understood variable, with a rollback path
- 9Measure againCompare with the recorded baseline
Start with evidence, not guesses
Record the incident window first, including time zone. Identify the affected database, application, login, and host if possible. Ask whether every request was slow or one operation was slow, whether failures accompanied latency, and whether the problem is still active.
Collect a small baseline of CPU, logical reads, physical reads, writes, duration, waits, and blocking. These signals answer different questions. High CPU suggests expensive computation or excessive execution frequency. High reads suggest the query is touching more pages than expected. Writes may point to modifications, TempDB use, or spills. Waits describe where workers were unable to make progress. Blocking describes dependency between sessions, not necessarily a slow query in isolation.
Preserve evidence before restarting services or clearing caches. Capture Query Store history, active requests, wait information, and relevant monitoring graphs. A restart may improve the symptom while destroying the state needed to explain it.
Check active requests
During an active incident, sys.dm_exec_requests shows work currently executing. Join it to sys.dm_exec_sessions for client context and use sys.dm_exec_sql_text to retrieve the submitted text.
SELECT
    r.session_id,
    s.login_name,
    s.host_name,
    DB_NAME(r.database_id) AS database_name,
    r.status,
    r.command,
    r.blocking_session_id,
    r.cpu_time,
    r.total_elapsed_time,
    r.logical_reads,
    r.reads,
    r.writes,
    r.wait_type,
    r.wait_time,
    SUBSTRING(
        txt.text,
        (r.statement_start_offset / 2) + 1,
        CASE
            WHEN r.statement_end_offset = -1 THEN LEN(CONVERT(nvarchar(max), txt.text))
            ELSE (r.statement_end_offset - r.statement_start_offset) / 2 + 1
        END
    ) AS statement_text
FROM sys.dm_exec_requests AS r
JOIN sys.dm_exec_sessions AS s
  ON s.session_id = r.session_id
CROSS APPLY sys.dm_exec_sql_text(r.sql_handle) AS txt
WHERE r.session_id <> @@SPID
  AND s.is_user_process = 1
ORDER BY r.total_elapsed_time DESC;
Reading these DMVs requires the appropriate server-state permissions. Treat query text as potentially sensitive operational data. Restrict access and avoid copying parameter values into unsecured tickets or chat messages.
Elapsed time alone is not enough. A request may have a long duration because it is blocked while consuming little CPU. Another may finish quickly but execute thousands of times. Capture multiple samples when possible so you can distinguish a persistent request from a momentary snapshot.
Group the workload
Grouping reveals whether pressure comes from one application identity, database, host, or request state. This is especially useful when many individual sessions make the active-request list noisy.
SELECT
    s.login_name,
    DB_NAME(r.database_id) AS database_name,
    s.host_name,
    r.status,
    COUNT(*) AS active_requests,
    SUM(r.cpu_time) AS cpu_time_ms,
    SUM(r.logical_reads) AS logical_reads,
    SUM(r.writes) AS writes
FROM sys.dm_exec_requests AS r
JOIN sys.dm_exec_sessions AS s
  ON s.session_id = r.session_id
WHERE s.is_user_process = 1
GROUP BY
    s.login_name,
    DB_NAME(r.database_id),
    s.host_name,
    r.status
ORDER BY logical_reads DESC;
The totals are for requests active at the instant of the query, not complete historical accounting. Use them to orient the investigation, then move to Query Store or monitoring telemetry for a longer window.
Grouping by host can reveal a deployment that created excessive concurrency. Grouping by login can expose an integration account dominating the server. Grouping by database prevents a busy but healthy workload from distracting you from the affected application.
Look for blocking
blocking_session_id identifies the session preventing a request from acquiring a required resource. The blocked session is the victim of the wait, but the blocker is not automatically at fault. It may be performing legitimate work inside a transaction while the application holds the transaction open longer than intended.
Build the blocking chain. Find the head blocker, inspect its current or most recent statement, transaction state, application, and duration. Look for sleeping sessions with open transactions, large modifications, incompatible isolation behavior, or DDL operations.
Do not make “kill the blocker” the default response. Rolling back a large transaction can take time and increase pressure. Terminating a business operation may also leave the application in an unexpected state. Decide with the application owner, understand rollback impact, and capture evidence first. The durable fix may be shorter transactions, consistent object access order, a better index, a different isolation strategy, or corrected application error handling.
Read the execution plan
An execution plan explains how SQL Server chose to access and combine data. Read it together with runtime metrics and the query’s purpose.
- Seeks can be efficient, but a seek repeated millions of times may still be expensive.
- Scans are not automatically bad; scanning a small table or most of a large table may be correct.
- Key lookups are useful for a few rows but can become costly when repeated for a large result.
- Join choices—nested loops, hash, or merge—depend on row counts, ordering, and available indexes.
- Spills indicate an operator needed more working space than its memory grant provided, often because estimates were wrong or available memory was constrained.
- Parallelism can reduce duration while increasing total CPU and concurrency pressure.
Compare estimated rows with actual rows at important operators. Large differences can lead to poor join order, join type, and memory grants. Also check how much data was read versus returned. A query returning ten rows after reading millions deserves attention even if its final result is small.
Operator cost percentages are optimizer estimates within that plan. They are not measured wall-clock percentages and should not be treated as a profiler. Start from actual duration, CPU, reads, waits, spills, and row counts.
Check statistics
Statistics describe data distribution to the optimizer. If they are stale, sampled poorly for an unusual distribution, or missing on an important expression, cardinality estimates can be wrong even when suitable indexes exist.
Check when relevant statistics were updated, how many modifications have occurred, and whether the histogram represents the values used by the slow query. Automatic statistics maintenance is valuable, but it cannot guarantee that every skewed or rapidly changing dataset is perfectly represented at every moment.
Update statistics deliberately and measure the result. A broad statistics update across a large database consumes resources and may trigger plan changes unrelated to the incident. If a statistics change fixes the query, document which estimate changed and why so the maintenance strategy can address the root cause.
Review indexes as a system
An index is useful when it reduces important reads or supports ordering, joins, and constraints at an acceptable write and storage cost. A covering index can include non-key columns needed by a query and avoid repeated lookups, but wider indexes cost more to maintain and cache.
Review existing indexes before adding another. Look for overlapping keys, duplicate definitions, indexes that differ only by a few included columns, and indexes maintained by every write but rarely used. Consolidation can be better than accumulation, but usage statistics reset and do not capture every business cycle, so do not drop an index from one short observation window.
Missing-index DMVs are clues, not instructions. Their suggestions are based on individual optimization events. They do not understand your complete index set, write workload, storage budget, or operational priorities. Several suggestions may be consolidated into one design, or rejected because they optimize an infrequent query at excessive write cost.
For a proposed index, record the target query, baseline plan and reads, expected write impact, and rollback plan. Re-measure after deployment.
Investigate parameter sensitivity
SQL Server can compile a plan using one set of parameter values and reuse it for different values. That is normally beneficial. It becomes a problem when different values require materially different strategies—for example, one customer has a handful of rows while another has a large fraction of the table.
Typical symptoms include intermittent latency, a query that becomes slow after recompilation or deployment, and multiple plans with very different resource use. Query Store is valuable because it shows plan history and runtime distributions instead of only the plan currently in cache.
Possible responses include rewriting the query, improving statistics, separating genuinely different workload shapes, using an appropriate query hint, recompiling selectively, or using plan-management features supported by the SQL Server version. None is a universal fix. OPTION (RECOMPILE) trades compilation work for a parameter-specific plan; forcing a plan may stabilize one case while harming another. Diagnose the data distribution and execution patterns first.
Use Query Store for history
Query Store retains query, plan, and runtime history inside the database. It is often the best starting point for a regression that is no longer active. You can compare execution duration, CPU, reads, execution count, and plan changes across time windows.
Use it to answer concrete questions: Did the query get a new plan? Did execution count increase? Did average duration change while the plan remained stable? Is one plan consistently better for the relevant workload, or does performance vary by parameter shape?
Plan forcing can be a useful mitigation while a durable correction is prepared, but it should be monitored. Data distribution and schema change. A once-good plan can become inappropriate, so record why it was forced and define how it will be reviewed.
Handle large modifications in batches
Large UPDATE, DELETE, and INSERT operations can generate substantial transaction log activity, hold locks for a long time, and create blocking. Batching limits the amount of work in one transaction and provides progress checkpoints.
DECLARE @rows int = 1;

WHILE @rows > 0
BEGIN
    DELETE TOP (5000)
    FROM dbo.EventHistory
    WHERE EventDate < DATEADD(year, -2, SYSUTCDATETIME());

    SET @rows = @@ROWCOUNT;

    -- Commit each batch when this loop is not already inside a wider transaction.
    -- Optionally add controlled pacing based on measured production impact.
END;
The batch size is an operational parameter, not a magic constant. Measure log generation, lock duration, throughput, and impact on concurrent work. Ensure the predicate is supported so each batch does not repeatedly scan the same large range. Design for restartability and confirm whether rows can change while the process runs.
Very large tables
For tables with hundreds of millions of rows, physical design and operational processes must agree. Index only the access paths that justify their maintenance cost. Maintain statistics with an approach suited to the modification pattern. Archive data when retention and query requirements allow it. Use incremental processing rather than repeatedly scanning or rewriting history.
Partitioning can make data lifecycle operations and elimination more manageable when the partition key matches those operations. It is not a general speed switch. Queries that do not filter on the partitioning dimension may gain nothing, and every partition adds management considerations.
Test batch operations against realistic data distribution and concurrency. A plan that works on a small restored subset may behave differently when statistics, memory needs, and index depth reflect the full table. The planned SQL Server at Scale roadmap covers partitioning, large modifications, statistics, and indexing in deeper articles.
Performance checklist
- Confirm the incident window, scope, and affected application.
- Identify the active workload and preserve evidence.
- Check blocking and build the complete blocking chain.
- Find expensive queries using CPU, reads, writes, duration, and frequency.
- Inspect actual execution plans and runtime metrics.
- Compare estimates with actual rows and review statistics.
- Review existing and proposed indexes as a complete system.
- Use Query Store to compare history and detect regressions.
- Change one understood variable and record the baseline.
- Measure after the change and keep a rollback path.
Closing thoughts
Good tuning reduces uncertainty before it changes the system. It identifies the workload, follows the evidence through waits and resource use, explains the execution plan, and measures the result of a controlled change.
Random fixes occasionally produce a faster query, but they do not create a repeatable operating practice. A documented investigation does. Capture enough context that the next engineer can understand not only what changed, but why it was the smallest appropriate change for the observed workload.
Related content
SQL Server
How to See SQL Server Table Sizes
Measure SQL Server row counts, reserved space, data, indexes and unused allocation without double-counting partitions or allocation units.
SQL Server
SQL Server Is Slow: A Practical Troubleshooting Workflow
A production-first workflow for turning a vague SQL Server slowdown into evidence, a likely cause, and a safe next step.

DevOps & Observability
Monitoring SQL Server Workloads in Real Time
Inspect active SQL Server requests, sessions and connections, then connect current state to retained Query Store history.